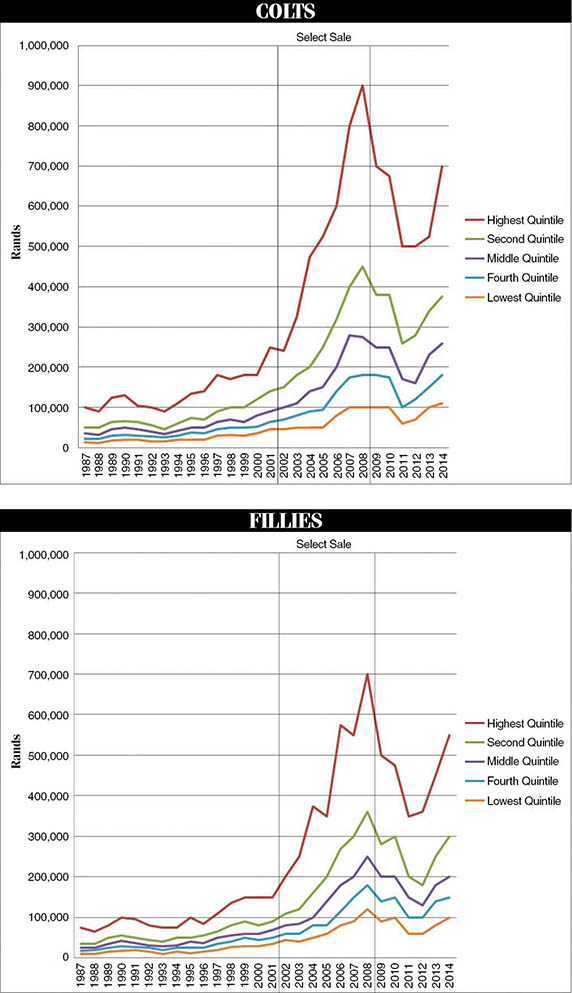
Money isn’t what it used to be. Even so, the spectacular spend on thoroughbred yearlings in recent times has to be seen to be believed.
Nothing like a good graph to do that. Shown is the progression of National Sale prices, split by sex. For every sale since 1987 the prices are grouped in five equal segments: top 20%, next highest 20%, middle 20%, down to bottom 20%. Those are called quintiles.
For each of the quintiles the median sale price (the mid-point between highest and lowest price in that quintile) is graphed. The middle quintile also represents the overall median of the sale in total.
It may be coincidence, but the steepest incline in the top group follows the introduction of the Select Sale at Nationals in 2002. A small portion of the catalogue was selected on conformation and pedigree, printed on green coloured pages, and staged as the Select Sale opening of the auction.
The vertical lines on the graph show the introduction and later abolishment of the Select Sale. The end of Select coincides with a sharp drop in the highest group in 2009 (possibly also helped by the stock market crash of 2008).
The hegemony of Nationals was challenged by the introduction of the Cape Premier Yearling Sale in January 2011.
The new sale was first staged by BSA (which also ‘owns’ Nationals), but a year later in 2012 by CTS (a new sale company). From its inception the Cape Premier Sale attracted quality yearlings which otherwise would have found their way to Nationals.
It also caused Nationals to include in its catalogue yearlings which otherwise might not have qualified for the sale. Recovery followed for Nationals subsequently, partially due perhaps to CTS significantly reducing the number of yearlings offered at the Cape Premier Sale from 2013 onwards.
It’ll be interesting to see what happens at Nationals this year, with the CTS sale in January 2015 having shown an increase in overall median price of some 14%.
Two Decades at the Nationals
| date | sold | not sold | withdrawn | gross | colt median | filly median | all median |
| 1995/04/01 | 503 | 102 | 44 | 30 315 000 | 50 000 | 40 000 | 45 000 |
| 1996/04/01 | 473 | 75 | 64 | 28 332 000 | 50 000 | 40 000 | 45 000 |
| 1997/04/01 | 457 | 63 | 57 | 34 249 000 | 65 000 | 50 000 | 55 000 |
| 1998/04/01 | 427 | 62 | 61 | 39 193 000 | 70 000 | 60 000 | 60 000 |
| 1999/04/01 | 459 | 52 | 44 | 38 872 000 | 70 000 | 60 000 | 60 000 |
| 2000/04/01 | 442 | 67 | 53 | 40 916 000 | 80 000 | 60 000 | 70 000 |
| 2001/04/01 | 407 | 84 | 52 | 43 200 000 | 90 000 | 70 000 | 80 000 |
| 2002/04/01 | 393 | 88 | 34 | 47 839 000 | 100 000 | 80 000 | 90 000 |
| 2003/04/01 | 426 | 66 | 51 | 63 115 000 | 110 000 | 90 000 | 100 000 |
| 2004/04/01 | 447 | 51 | 62 | 89 007 000 | 140 000 | 100 000 | 120 000 |
| 2005/04/29 | 474 | 36 | 41 | 104 955 000 | 150 000 | 140 000 | 150 000 |
| 2006/05/01 | 472 | 31 | 46 | 136 030 000 | 210 000 | 180 000 | 200 000 |
| 2007/05/04 | 476 | 49 | 46 | 161 260 000 | 280 000 | 200 000 | 250 000 |
| 2008/04/04 | 501 | 57 | 42 | 199 650 000 | 275 000 | 250 000 | 260 000 |
| 2009/04/04 | 490 | 58 | 48 | 152 120 000 | 250 000 | 200 000 | 220 000 |
| 2010/04/23 | 490 | 63 | 50 | 159 925 000 | 250 000 | 200 000 | 225 000 |
| 2011/04/15 | 472 | 65 | 63 | 115 310 000 | 175 000 | 150 000 | 150 000 |
| 2012/04/26 | 372 | 62 | 33 | 86 740 000 | 170 000 | 130 000 | 150 000 |
| 2013/04/26 | 411 | 86 | 40 | 122 468 000 | 230 000 | 180 000 | 200 000 |
| 2014/04/27 | 398 | 72 | 59 | 138 415 000 | 260 000 | 200 000 | 240 000 |


