I often see comments both on Sporting Post and other venues alleging that three-year-old horses are at a disadvantage to older horses despite the weight-for-age(WFA) allowances intended to level the playing fields.
With the July Handicap once again at our doorstep this becomes a topical issue this time of year as the better three-year-olds take on their older competitors, writes Jay August.

Are three-year-olds really at a disadvantage to their older foes even after allowing for the WFA advantage?
Below I’ve summarised almost 6 years of data, from August 2013 to May 2019, for open handicaps comparing all three-year-olds over all distances against older horses (4 and older).
I’ve chosen open handicaps because they offer the greatest number of data points, are the most competitive races, apply the WFA scale, are run often and over many distances.
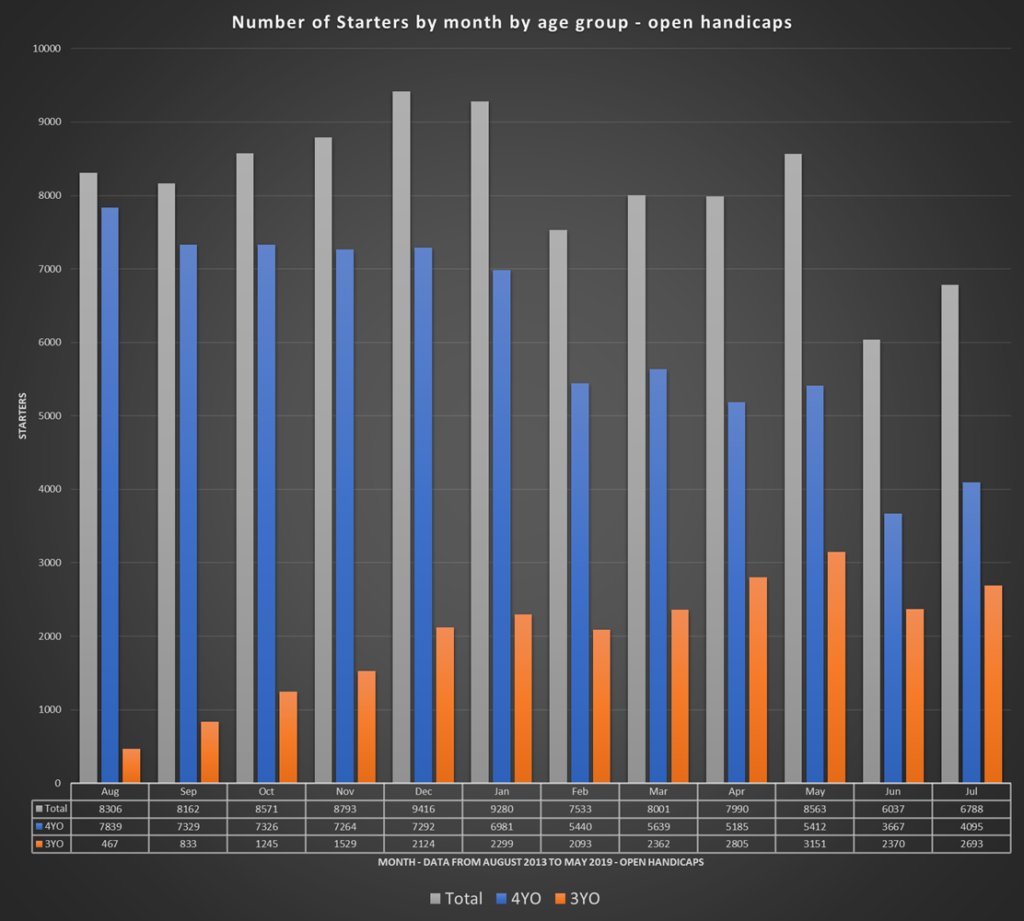
The data consists of 97000 lines of form of which 24000 are for three-year-olds and the remainder older horses. There is an average of 8100 starters per month with a peak in December and January and a trough in June and July.
Below is a chart of the number of starters by age and by month over the sample period. You will observe that as the year progresses there are more three-year-olds starters, with a peak in three-year-old starters in May.

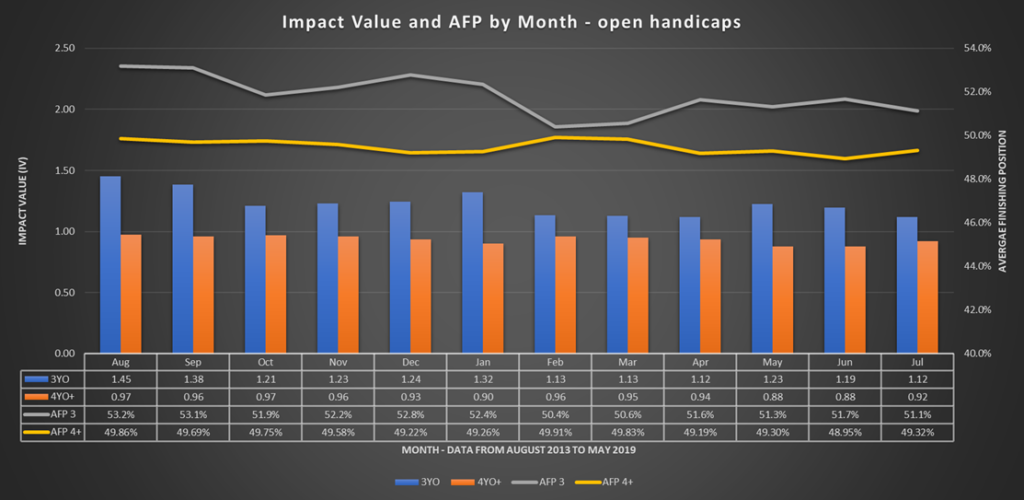
The chart below shows the strike rate and the average finishing position for three-year-olds versus older horses.
Strike rate I have named Impact Value as it is modified for field size. The entire data has an Impact Value of 1 (the average for all data). An Impact Value of 1.2 indicates that the observations from the data are 20% better than average, while an Impact Value of .80 indicates that the observations are 20% worse than average.

Average finishing position (AFP) is expressed as a percentage in order to modify for field size.
Therefore, a value of 50% indicates that a horse beat no more horses than beat it. A horse finishing first will have an AFP of 100% as it beat 100% of its opponents while a horse finishing last will have an AFP of zero. Impact Value (or field size adjusted Strike Rate) is indicated as bars at the bottom of the graph while Average Finishing Position (AFP) is shown at the top as lines.

What you’ll observe in this chart is that three-year-olds are at an advantage to older horses in every single month with the outperformance being more pronounced in the first half of the season.
Impact Value for three-year-old runners is above 1.2 in the first five months of the season and above 1 in all remaining months.
Over the entire racing year three-year-olds win 20% more races than average and 27.78% more races than older horses.

Three-year-olds also finish with more horses behind them than in front of them – 51.63% versus 49.52% over the 12 months. The grey line at the top of the chart shows that they always have more than 50% of the field behind them, while the opposite applies to older horses.
There is no truth to the observation that three-year-olds are at a disadvantage to older horses at any point in the racing year.
Individual horses may differ but as a group the data is unequivocal; that three-year-olds are at an advantage to older horses. The data above for handicaps can be shown to be true in every other type of race from Maiden through to Graded races, although with the latter the number of observations is very small. The data evidence also holds up for any distance from 1000m to 3200m. Net Merit Rating for the groups is remarkably similar with only a very small and insignificant difference in favour of the younger horses evident.
Rather than decrying the inability of three-year-olds to beat older horses we should be asking for a review of the WFA scale, to even the playing fields and give older horses a better chance of beating their younger competitor’s.
The British Horseracing Authority made a slight adjustment to their WFA scale in 2017 as a result of similar analysis conducted from 2010 to 2015.
South African horseracing needs to consider doing the same review and possible change.
Click here for a PDF of the charts for those who cannot see them clearly in this letter
Ed – on 25 June 2019, the writer Jay August provided this additional graphic for discussion:


