 The July draw has come and gone with its usual drama, emotion and histrionics. Now that the dust has settled how does history favour each draw participant.
On his blog, southafricanracehorse.wordpress.com, Jay August writes:
Below I have charted the statistics for each barrier position from 1950 through to 2018, a span of 69 years. The July has undergone much change over the years with the weights compressing quite significantly in the last 2 decades as the conditions of the race have changed. What has not changed much are the number of runners. So, what does history tell us are the likely probabilities for each horse winning or finishing in thetop four?
Have you read the latest SP Digest? Click on the image below:
Below is a chart of the runners and winners for each draw position over the last 69 years.
The draw with the highest number of wins has been position 11 while the barrier position with the highest probability of winning has been draw 20!
Although there is a sharp drop in winners from draw 14, good horses it seems are never stopped by a bad draw. Dynasty, Flaming Rock and Pomodoro will attest to that having all won from draw 20.
The two worst draws from a probability standpoint are not in the car park but much closer to the inside, draw 1 and draw 9, which have managed to produce only 1 winner each from 69 starters.

In the next chart I’ve clustered the draw into three’s, so draw 1 to 3 is clustered as 1-3 etc.
I’ve also clustered draw 16-20 together to get a similar number of observations to all other barrier positions. Individual barrier positions may have been subject to random variables all of which negate history as a predictor of the future.
Clustering draw positions increases the odds that random events play a smaller role and so give us greater predictive ability. Looking at the draw data this way tells us that the sweet spot is draw 4-6 followed by draw 10-12.

We can take this a step further and examine if the winning draw bias is seen with top 4 finishers.
The chart below shows the draw stats, clustered as above for all top 4 finishes. We see a very similar trend to that with win data.
Draw 7-9 seems to produce far fewer winners and places than one would expect while draw 10-12 does the opposite.
The trend for draw 4-6 remains solid. All this is good news for Barahin and Rainbow Bridge.

Lastly, I determine if there are any inherent bias’s in the individual draw numbers.
I have subjected each cluster to a ranking. I’ve looked first at the starting price or odds (SP) and ranked those in order from favourite upwards.
A ranking of 1 is the lowest odds. Similarly, I have ranked the handicapper rating. As there were no MR ratings prior to 2000, I have used the weight assigned, adjusted for WFA, to assign a ranking which would be like the MR.
A ranking of 1 is the horse with the highest MR or MR proxy. That chart is below.

Oddly, this chart shows that some of the better ranked horses and the lowest odds horses start from barrier position 1-3, while their performance for both wins and top four finishes does not quite live up to expectation.
The out-performance of barrier 10-12 can be partly explained by that draw range having both the lowest (best) handicap ranking and second lowest odds ranking.
Barrier position 4-6 however presents an anomaly. It produces some of the best results for wins and top four finishes yet has some of the worst ranked horses.
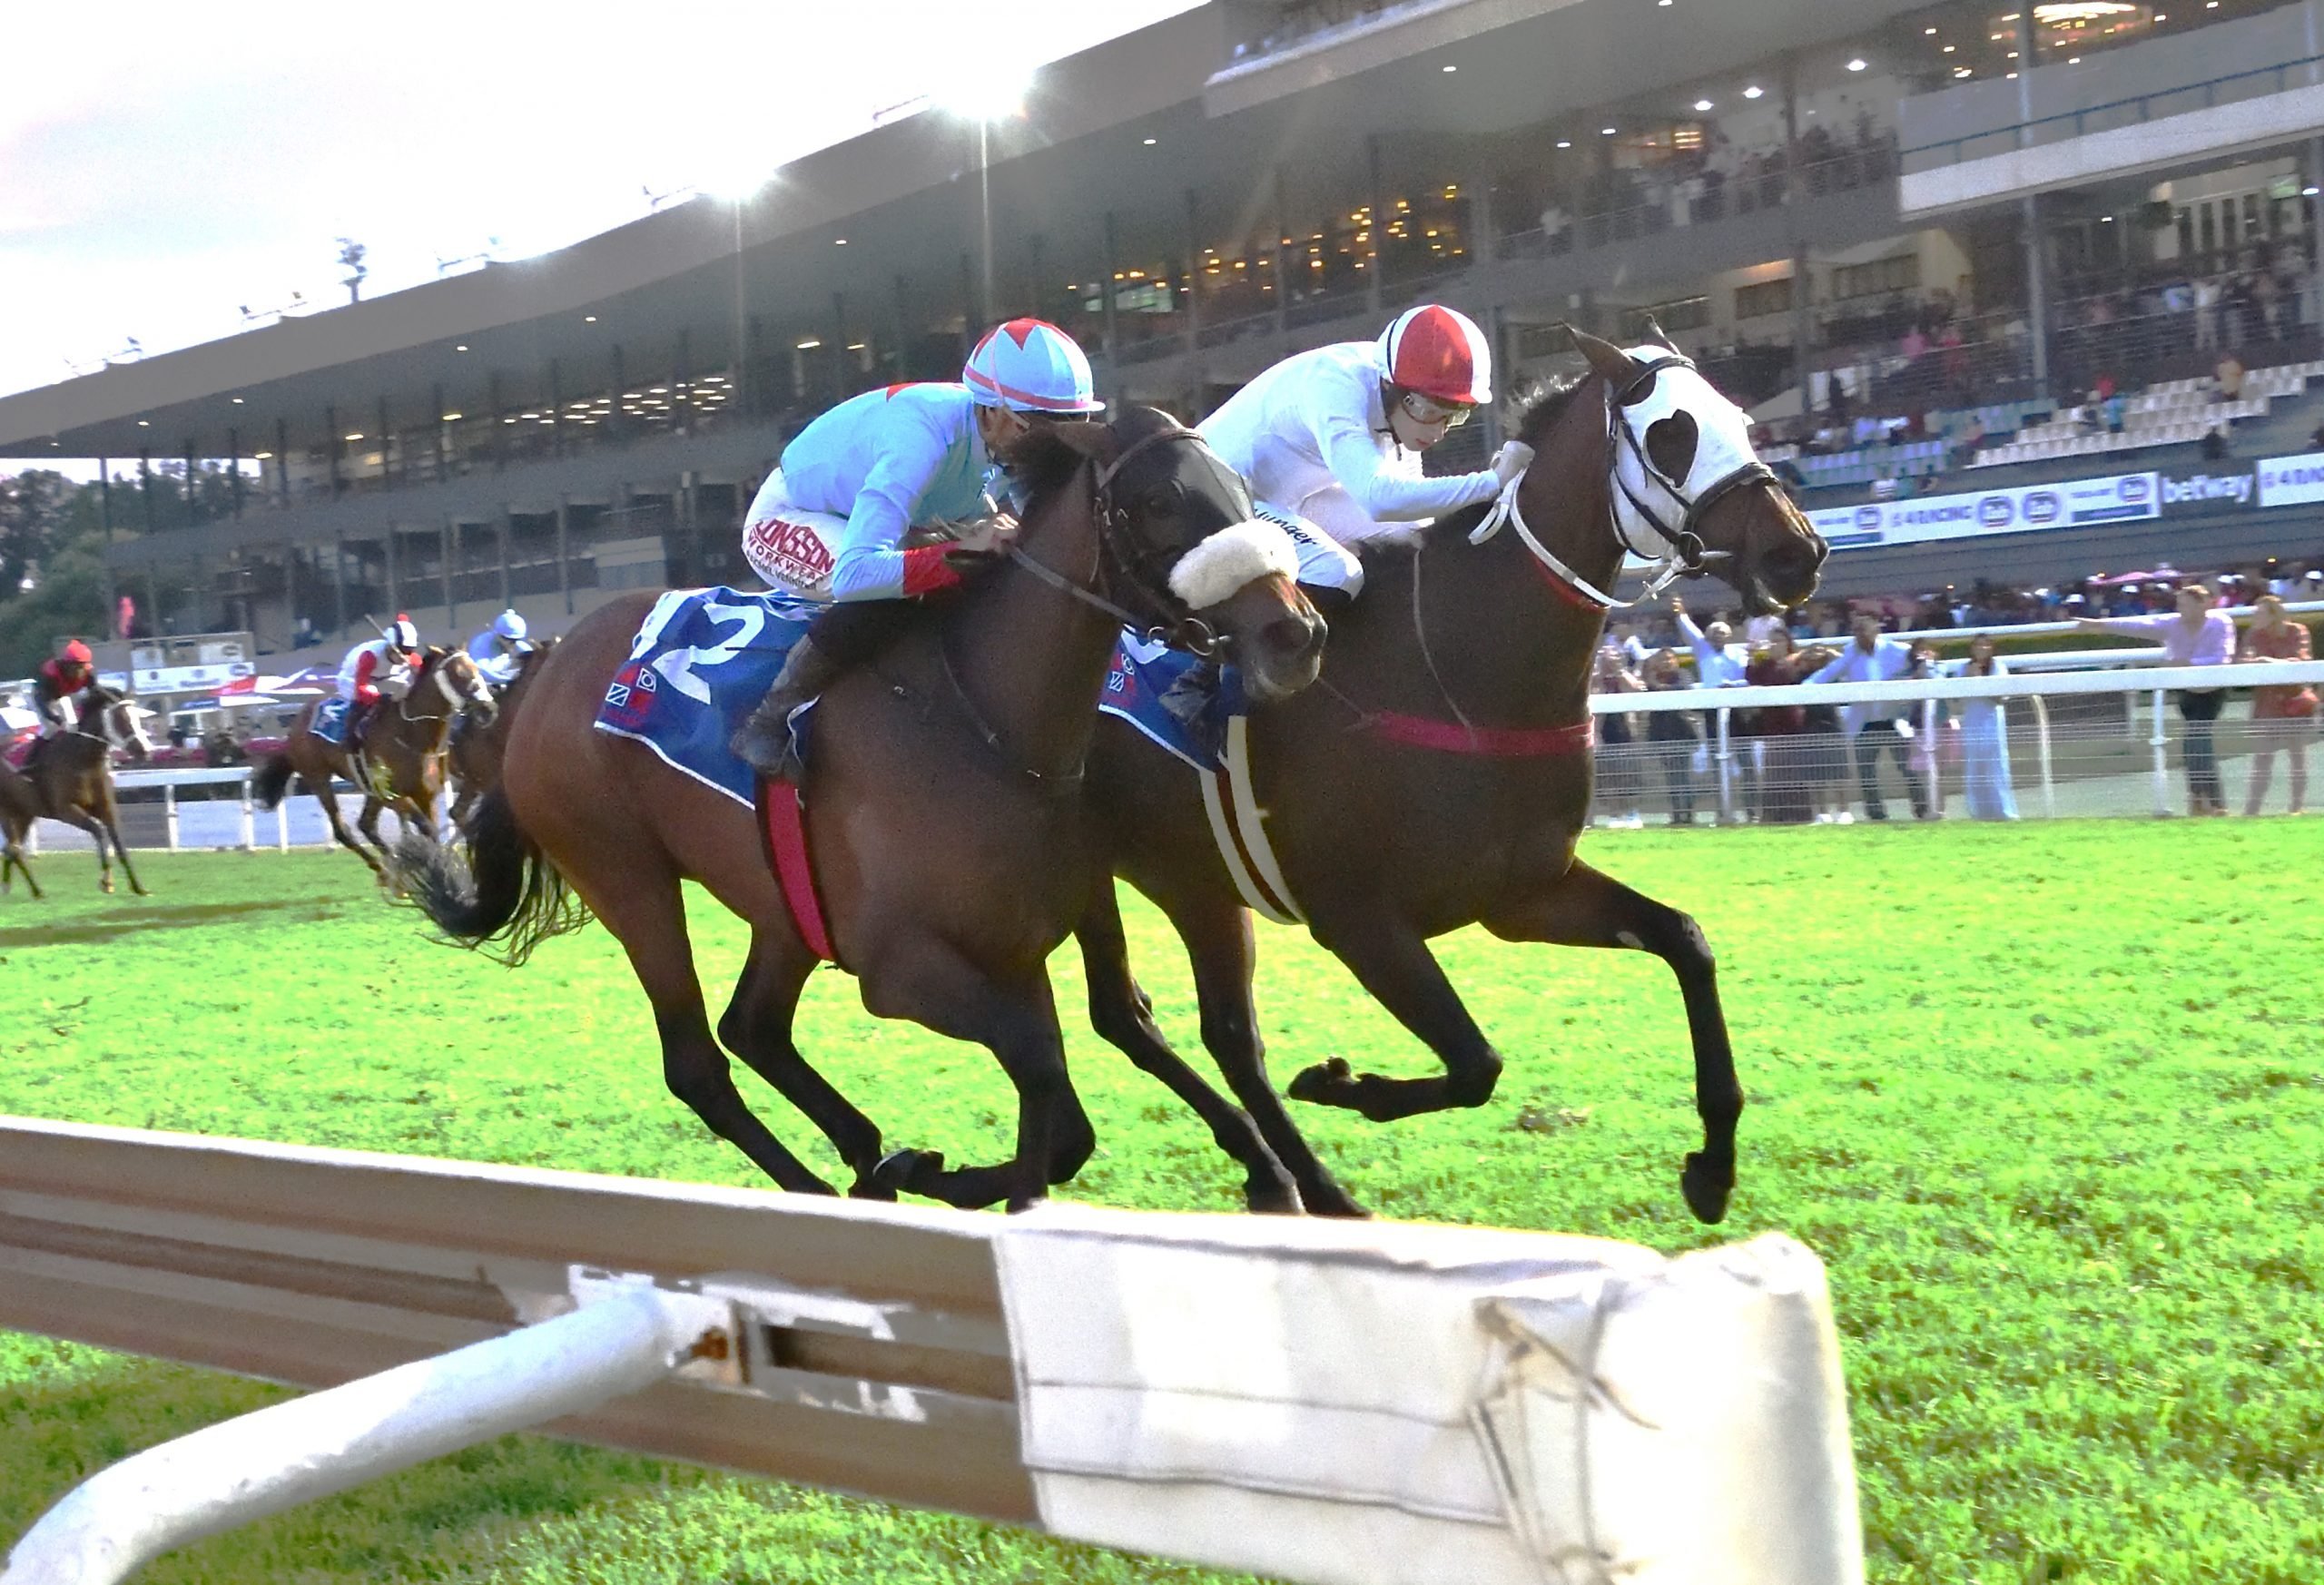
How will barrier position history predict this year’s July – perhaps by some twist of fate Joey Ramsden’s behaviour at the official draw will be rewarded with a win.
Addendum
I have had a valid observation made that as the Durban July has been run on a modified track since 2014, post the introduction of the inner polytrack, that the data pre 2014 may not be reliable or valid for current analysis.
Analysing data from 2014 onwards presents problems because we only have 5 years of data.
However in order to test the possibility that there has been a very significant change let’s look at the periods 2000 to 2013, which represents the modern merit rating era, and the period 2014 to 2018, which continues that era but on the new track.
I only compare clustered info i.e. draw 1-3 etc as individual draws will have too few observations.
The three charts immediately below are the win, top-four and ranking stats for the period 2000-2013 when maximum field size was still 20.
The trend is mostly in line with the previous observations over 69 years except that barrier 1-3 does much better on both scores.
Ranking is somewhat telling though – here the under-performance of draw 7-9 is consistent with a much poorer class of horse as evidenced by the very low handicap ranking.


Now let us look at the same three charts for the period 2014 to 2018.
The first chart of wins has too little data to have any message and so is best ignored. The top-4 chart once again shows that draw 7-9 is not a good draw but this time is not explained by a poorer class of horse running.
The most telling part of the limited data from 2014 onwards is that draw 16-18 produces the best stat for top-4 finishes and has so far been the new tracks better draw, even though it has a poorer class of horse running.
Curiously the last chart has a strange trend where the better class horses are drawn better and that trend is consistent from draw 1 – 18. I’d not infer much from it as it is only 5 years of data but if this trend continues into the future it requires some explanation beyond mere randomness.


None of this is definitive given the lack of enough data points. The only observations I can make from the data post 2013 (the new track) is that draw 16 and above is not as disadvantageous as it once was.
Draw 7-9 seems to have the same bias against performance it has always had, while draws 4-6 and 10-12 have no significant change from the first analysis.
Which leads me back to Twist of Fate. Is draw 17 such a disadvantage – apparently not?